Grade Checking
Functionality and Purpose
The grade checking feature calculates the difference between a 3D layer design and the current construction progress based on measured points.
This unique DatuBIM feature enables you to create a digital 3D object model from 2D layer design files: horizontal alignment, vertical profile, and cross-sections. Comparing this virtual 3D data object of the layer to imported survey points, Grade Checking automatically analyzes and delivers grade checking reports.
Grade Checking compares the height of the uploaded survey points with the height of the corresponding points in the virtual layer design and gives accurate numbers representing the height difference.
- Uploading the design layer files,
- Uploading the survey measured points, and
- Generating the grade checking report.
Uploading Layer Designs
- Enter the site for which you are going to generate the grade checking report and choose “Designs”.
- To upload the layer designs, click on “Add design”, and select the "Road/Rail Design" option.
1. Use the 2D layer design files, or2. Use LandXML surface design files
Using the 2D layer design files
- Choose “CAD Designs” tab (this is the default selection)
- Upload the three DXF files: 1) Horizontal alignment 2) Vertical profile 3) Road/Rail section/station.
Complete details about the structure and requirements of the three dxf files can be found in the article Format Requirements for Importing Road/Railway Design DXF Files.
Downloadable templates (examples) of the dxf files can be found in the article Design File Templates for Grade Checking.
- Enter the
name of the design
- If you want to organize your designs in categories, choose an existing category or create a new one.
- Click on “Add” to upload the designs.
Using the LandXML surface design files
- Choose “Surface Designs” tab
- Select surface files according to instructions given by clicking on the
shown next to each line.
Downloadable templates (examples) of the xml files can be found in the article Design File Templates for Grade Checking. - Enter the name of the design
- If you want to organize your designs in categories, choose an existing category or create a new one.
- Click on “Add” to upload the designs.
Using either method, DatuBIM will process the files for the virtual surface generation in prep for the grade checking process.
When the processing ends successfully, you will be ready to add the surveyed points to generate the report.
Adding Survey Measured Points
- To add the points measured in the field by the ground surveyor, click on “+ Add” in the flight timeline and choose “Add measured points”.
- In “Add measured points” window, upload a CSV file of the surveyed points, holding name, e, n, and h. You can download a sample of the required file format by clicking on “Download file template.” Enter the date of the measured points, and then click on “Add”.
- The measured points will be added to the timeline according to the measurement date.
If up to 3 sets of measured point are added after the last tracked instance of between two instances, they will be shown as separate markers on the time line.Hovering over one of the markers on the time line will show the user who added the measured points, the number of points added for that date, the date of the measured points, an icon to generate reports, and a 3 dots menu as shown below.
If more that 3 sets of measured points are added after the last tracked instance of between two instances, only one marker appears on the time line for the different dates. Hovering over the marker on the time line will show a list of dates of measures points showing the number of points added for that date, the user who uploaded the measured points, an icon to generate reports, and a 3 dots menu as shown below.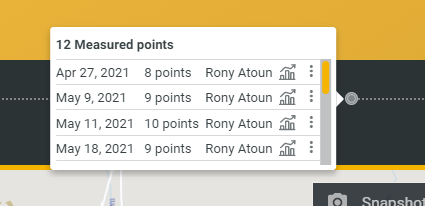 Clicking on the 3 dots menu in either case allows you to edit or delete the set of measured points as shown below.
Generating a Grade Checking Report
- Go to one of the sets of measured points that have been added to the timeline and click on “Generate Report”.
- In the “Generate Grade Checking Report” dialog, you can see the surveyed points overlayed on the site model.
- Specify for which points you want to generate the grade checking report. You can do this either by adjusting the region of interest to surround specific points or ticking the checkbox next to the points you want to check.
- Click on “Continue.”
- In the following dialog, use the “Road/Rail Design Name” dropdown to select the design you want to compare your points to.
- In “Layer Description” enter a descriptive text for the base layer.
- In “Distance From Top” enter the offset from the top layer of the design to compare your points to. This value is always a negative number as it is always below the top layer.
- In “Generated Report Name” give the report a name. A default name that includes the date and number of points will appear but you may change it.
- Click “Generate Report”. Once done, the generated report is immediately saved and downloaded to your standard download folder.
- If you try to generate a grade checking report for a set of measured point where a grade checking report was previously generated, the dialog below will appear to show you all grade checking reports that were previously generated for it. Here you may download one of the existing reports by hovering over the line of the report and clicking on the download button on the right, or you may select to generate a new report as well. Reports must have unique names.
Downloading a Grade Checking Report that Was Previously Generated
Once a grade checking report is ready, it can also be download it from the download section on the top-right menu.
- In the “Download” dialog, choose Measured Points” from the “Analytics instance” dropdown.
You can also filter by date.
- Download the required report by hovering over the line and clicking on the download button on the right, or check the box of the report(s) and click on “Download selected” on the top right of the window.
The Grade Checking Report
- On the first page of the report, you can see general information including a picture of the site, the name of the site, date of measured points, information about cross section numbers, and The distance from the top of the design that was compared to the measured points.
- On the last page, you have legend of the colors and other valuable information.
- In between, you will see a list of measured points, a color coded difference in height from the selected design layer, and other valuable information as well.
Related Articles
Design File Templates for Grade Checking
Templates for Importing Grade Checking Design Files In the below attached ZIP-file you will find templates for importing grade checking design files. Templates of CAD Designs (DXF) HL-50.dxf is a Horizontal Profile DXF file format VL-50.dxf is a ...Introducing Surface and Road Grade Checking Reports in DatuBIM
As part of our ongoing commitment to enhance your construction management experience, we are excited to introduce two new reports in DatuBIM: Surface Grade Checking and Road Grade Checking. These powerful tools are designed to provide you with ...New Features Announcement, June 14, 2022
Create Road/Rail Designs from LandXML Surface design files User is now capable of generating virtual layers to be used with grade checking option using LandXML surface design files. This is another level of flexibility given to the user. Various Bug ...New Features Announcement, May 2021
Grade Checking Grade checking is frequent, time-intensive surveying of terrain changes to monitor construction work, track progress, ensure quality, and detect deviations in the layer buildup. Infrastructure projects such as highways and railways ...Cross Section Volume Calculation and Report Generation
Cross section volume calculation and report generation is an advanced feature that was added for any road design. It basically gives you the option to calculate fill and cut volumes between two cross section stations and generate a detailed report of ...